Strengthen your decisions with unmatched accuracy
Tianmu's cutting-edge soil moisture technology delivers daily insights into soil moisture levels across any location globally, bringing revolutionary changes to agriculture, business, and environmental protection.
Application
Data Sheets
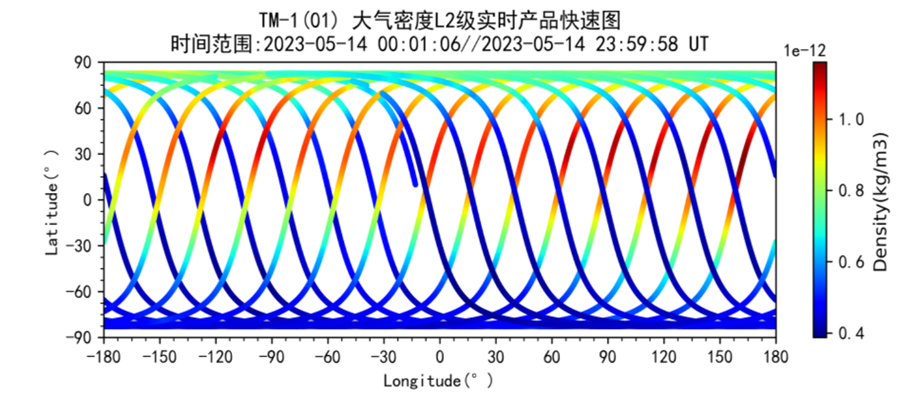
| L2 | Orbital Atmospheric Density |
|---|---|
| Contents | Obtain the spatiotemporal distribution of atmospheric density in a sun-synchronous orbit of about 500 km, allowing for simultaneous acquisition of orbital atmospheric density at different spatial locations at the same altitude. |
| File Naming | atmDns_DQMD_LLL.YYYYMMDD_HHMMSS_UUUUU_L2.txt |
| File Format | txt |
| Data Domain Information | 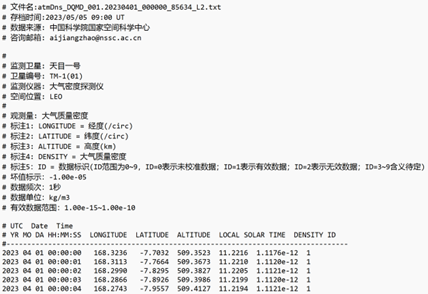 Columns 1-6 represent UTC time in the format YYYY MM DD hh mm ss. Column 7 indicates geographic longitude in degrees. Column 8 shows geographic latitude in degrees. Column 9 represents the orbital altitude in kilometers. Column 10 displays local time in hours. Column 11 presents atmospheric mass density in kg/m³. Column 12 is the data quality flag ID: 0 indicates uncalibrated data, usually caused by the payload sensor not facing the wind due to satellite attitude; 1 indicates valid data; and 2 represents invalid data, often caused by platform venting or sensor power-on venting. |
| Technical Specifications | Temporal Resolution: <2 seconds Detection accuracy: better than 10% |
| Daily data growth from a single satellite | About 4MB |
| Image | 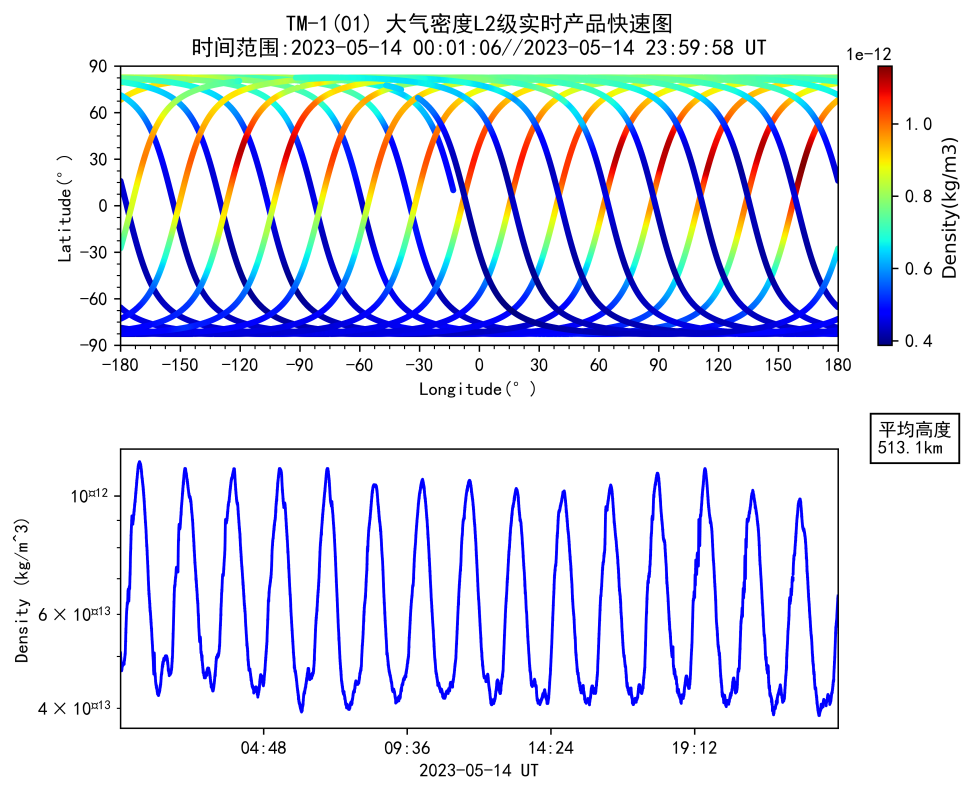 |
| L1 | Level 1 orbital atmospheric density product |
|---|---|
| Contents | Sensor pressure and temperature data. |
| File Naming | atmPreTem_DQMD_LLL.YYYYMMDD_HHMMSS_UUUUU_L1.txt |
| File Format | txt |
| Data Domain Information | 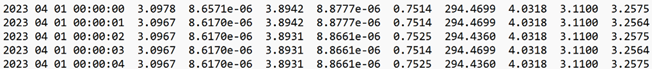 Columns 1-6 represent UTC time in the format YYYY MM DD hh mm ss. Column 7 indicates the analog voltage (V) of sample chamber pressure 1. Column 8 shows the physical value (Pa) of sample chamber pressure 1. Column 9 indicates the analog voltage (V) of sample chamber pressure 2. Column 10 shows the physical value (Pa) of sample chamber pressure 2. Column 11 indicates the analog voltage (V) of sample chamber temperature. Column 12 shows the physical temperature (K) of the sample chamber. Column 13 indicates the voltage value (V) of the power supply detection. Column 14 indicates the voltage value (V) of the filament detection. Column 15 indicates the voltage value (V) of the electron current detection. |
| Daily data growth from a single satellite | About 6MB |
| L0 | Raw payload data packet |
|---|---|
| Contents | Raw observation data of the payload |
| File Naming | atmPTori_DQMD_LLL.YYYYMMDD_HHMMSS_UUUUU_L0.txt |
| File Format | txt |
| Data Domain Information | 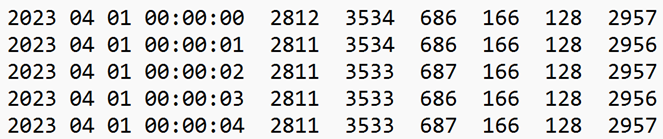 Columns 1-6 represent UTC time in the format YYYY MM DD hh mm ss. Column 7 indicates the decimal value of pressure in sample chamber 1. Column 8 indicates the decimal value of pressure in sample chamber 2. Column 9 indicates the decimal value of temperature in the sample chamber. Column 10 indicates the decimal value of the power supply reading. Column 11 indicates the decimal value of the filament reading. Column 12 indicates the decimal value of the electron current reading. |
| Daily data growth from a single satellite | About 3MB |